
Track all of your key business metrics from one screen
GET STARTED
 Adobe Analytics
Revenue
Adobe Analytics
Revenue Revenue is a metric that measures the total income generated by a business through sales of products or services, calculated before deducting any expenses. It is a key indicator of a company's financial performance and growth.
With Databox you can track all your metrics from various data sources in one place.
Revenue is a financial metric that represents the total amount of money a business makes through the sale of goods and services from its normal operations.
It’s one of the primary measurements of a company’s financial performance and it’s typically reported on the income statement.
Revenue doesn’t take into account any expenses associated with the production or delivery of goods and services and it’s not the same as profit or net income.
Investors, analysts, and stakeholders all look at revenue to evaluate a company’s growth, market position, and overall financial health.
To calculate revenue, you need to multiply the number of units sold by the price per unit.
The formula goes like this:
Revenue = Number of Units Sold x Price per Unit
For example, let’s say a company sells smartphones and in a given month, they sold 1,000 units of smartphones at a price of $500 per unit.
Using the formula, we see that the company’s revenue for that month is $500,000.
Now, it’s important to note that revenue can be calculated for different time periods, such as daily, monthly, quarterly, or annually. The formula remains the same, you just need to adjust the numbers based on the relevant time period.
Instead of looking at the exact amount of money a business makes, a lot more useful information can be found in its profit margins.
Now, a good profit margin is highly subjective and can vary across industries, business models, and economic conditions. Other factors include industry norms, business size, competitive landscape, and overall company goals.
For example, retail businesses typically operate on lower profit margins due to higher operational costs and fierce competition. A good profit margin for retailers often ranges between 2% and 7%.
In the service-based industry sector, such as consulting firms, businesses tend to have higher profit margins. This can be anywhere from 10% to 30% or higher, depending on the nature of the provided services.
Technology-driven industries, such as software development or IT services, also have higher profit margins due to lower production costs and scalability. Profit margins in the technology sector can be as high as 20% to 40% or more.
It’s important to note that these figures are general benchmarks and can vary significantly depending on the specific circumstances of your business.
Seeing that revenue is practically the lifeblood of any modern business, it’s not surprising that looking for ways to increase it is one of the key objectives for many organizations.
And while there are hundreds of different approaches that you can take, we compiled a few interesting strategies that we found while talking to hundreds of leading experts on the topic.
These strategies include:
More resources to help you improve:

Used to show a simple Metric or to draw attention to one key number.
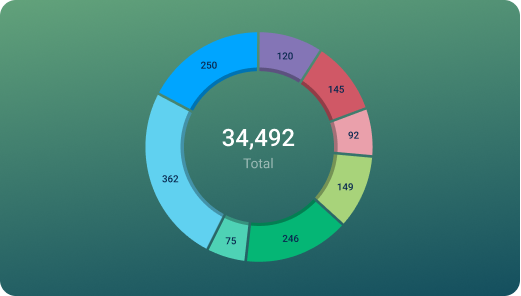
Used to illustrate numerical proportions through the size of the slices.

Used to show comparisons between values.
Databox is a business analytics software that allows you to track and visualize your most important metrics from any data source in one centralized platform.
To track Revenue using Databox, follow these steps:
 Goals
Goals Scorecards
 Metric Digest
 Metric Builder
 Data Calculations
 Performance Screen
Adobe Analytics dashboard template uses visits, conversion rates and customer loyalty to help you understand your customers as people — what they want, need, and believe.
Marginal revenue is the change in total revenue that comes from producing and selling one additional product unit. To calculate marginal revenue, you need to compare the change in total revenue when the number of units sold increases by one unit.
Here’s a formula you can use:
Marginal Revenue = (Total revenue for new quantity of units sold – Total revenue for current quantity of units sold) / (Quantity2 – Quantity1)
To calculate total revenue, you need to multiply the number of units sold by the price per unit.
The formula is straightforward:
Total Revenue = Number of Units Sold x Price per Unit
Revenue metrics provide crucial insights into the financial health and performance of a business.
They allow companies to track and measure their income generation, help identify trends in customer behavior, assist in setting realistic financial goals, and come up with suitable adjustments to optimize revenue streams.
Adobe Analytics
The Return Visits by Frequency metric in Adobe Analytics measures how many times a user has returned to a website over a certain period of time, allowing marketers to track loyalty and engagement.
Adobe Analytics
The Average Time on Site metric in AdobeAnalytics measures the average duration of time that visitors spend on your website or mobile app over a defined period of time.
Adobe Analytics
Mobile Views is a metric that evaluates the number of views that a website or app receives from mobile devices like smartphones and tablets. It helps to understand the popularity of the digital property on smaller screens.
Adobe Analytics
The Units metric in AdobeAnalytics represents the total quantity of items or products sold, viewed, downloaded, or otherwise tracked within a specific time period. This metric helps measure the success and impact of marketing campaigns and product offerings.
Adobe Analytics
Cart Views is a metric that measures the number of times visitors viewed their shopping cart during a visit to an ecommerce site. It helps to gauge the effectiveness of the cart design and identify potential issues that may be preventing customers from completing their purchases.
Adobe Analytics
Cart Removals is a metric that tracks the number of times a user removes items from their shopping cart during a session on an e-commerce website. It helps to identify potential barriers or issues with the checkout process.
Adobe Analytics
The Checkouts metric in Adobe Analytics measures the number of times that customers initiated the checkout process on your website or app, providing insights into purchase intent and checkout funnel performance.
Adobe Analytics
The Revenue (traffic) by Top Traffic Sources metric helps identify which sources of website traffic generate the most revenue for a business, allowing for targeted optimization and marketing strategies.
Compare
Databox Inc.
HQ: Boston, MA, USA
AI-powered analytics for teams that need answers now.
Databox Inc.
HQ: Boston, MA, USA

AI-powered analytics for teams that need answers now.


Compare