
Track all of your key business metrics from one screen
GET STARTED
 Appfigures
Gross Revenue
Appfigures
Gross Revenue Gross Revenue is a key metric used to measure the total income generated from sales of an app, before any deductions such as commission fees or taxes.
With Databox you can track all your metrics from various data sources in one place.
Gross revenue is a financial metric that represents the total amount of money a business generates from its primary operations before deducting any costs or expenses.
While gross revenue doesn’t reflect a company’s profitability, it does provide an overall measurement of its top-line performance.
To calculate gross revenue, you need to multiply the total number of units sold by the price at which those units were sold.
The formula is straightforward:
Formula: Gross Revenue = Number of Units Sold x Price per Unit
So, if a company sells 500 units of a product at a price of $20 per unit, its gross revenue would be $10,000.
Gross revenue margin is highly relative and it’s based on several key factors, including your industry, competitive landscape, and specific business type.
In general, you won’t get much useful information by comparing your margin across industries, it’s a better idea to look at your niche peers.
For example, manufacturing companies typically have gross revenue margins ranging from 20% to 40%. However, highly specialized or niche manufacturing businesses may record even higher margins.
On the other hand, the software industry often enjoys higher gross revenue margins due to its relatively low production costs. Gross revenue margins in the software sector can range from 70% to 90%.
Ultimately, the goal for any business is to achieve a gross revenue margin that allows for covering costs, generating profit, and remaining competitive within its industry.
And while higher margins indicate better profitability, it’s crucial to consider specific industry dynamics and other financial metrics as well.
Gross revenue is one of the top financial metrics that stakeholders and C-level managers keep an eye on, and businesses are constantly looking for new approaches to try and increase it.
And while different strategies will work for different industries, there are some best practices that many top experts employ regardless of specific circumstances.
We talked to hundreds of experts over the last few years and found that a few go-to strategies they turn to include:
More resources to help you improve:

Used to show a simple Metric or to draw attention to one key number.
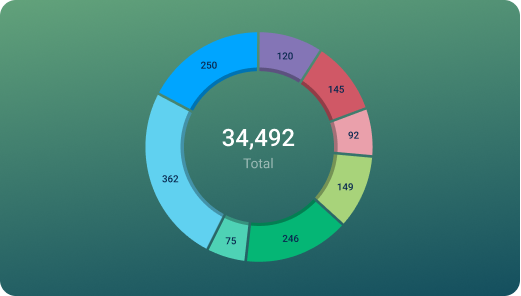
Used to illustrate numerical proportions through the size of the slices.

Used to show comparisons between values.
Databox is a business analytics software that allows you to track and visualize your most important metrics from any data source in one centralized platform.
To track Gross Revenue using Databox, follow these steps:
 Goals
Goals Scorecards
 Metric Digest
 Metric Builder
 Data Calculations
 Performance Screen
You can use this customizable Appfigures Sales Performance Overview Dashboard Template to track your sales performance and have clear insight into your refunds, returns, and net downloads.
If referring to total revenue that represents the total amount of money a company earns from its core business activities, then yes, gross profit measures the same thing.
Gross annual revenue is the total income a business or individual generates within one year, before deducting any expenses.
The best way to track and stay on top of gross revenue is by using business intelligence software like Databox.
Instead of tumbling with different manual reports and complex spreadsheets, you can use available integrations or custom APIs to connect your key financial metrics into a comprehensive dashboard.
Monitor your financial performance and most important KPIs in one place, in real-time.
Appfigures
Net Educational Revenue is the total revenue generated by an educational app or game, minus any refunds, chargebacks, or fees associated with the transaction.
Appfigures
Total Gross Revenue is a metric that measures the total revenue generated by an app from all sources, including in-app purchases, subscriptions, and paid downloads, before deducting any fees or commissions.
Appfigures
Transitions out by Country is a metric that shows the number of times users exited an app after opening it, grouped by the countries where these exits occurred.
Appfigures
The Grace Expired Off by Country metric shows the number of app subscriptions that have lapsed due to non-payment ("grace expired") by country.
Appfigures
The Ads Impressions by Country metric in AppFigures provides insights into the number of times an ad has been displayed to users in different countries. This helps advertisers understand where their campaigns are gaining traction and where they may need to make adjustments to better reach their target audience.
Appfigures
Ads ECPM (Effective Cost per Mille) is a metric that measures the revenue generated by every 1000 ad impressions. It helps app developers to understand the effectiveness of their ad monetization strategy and to optimize their ad placements.
Appfigures
Ads Fillrate by Country shows the percentage of ad requests that were filled with ads by country. It helps identify which countries provide the most revenue opportunities for your app through ad monetization.
Appfigures
The Ad Campaign CPC by Country metric in AppFigures shows the average cost per click (CPC) for each country where your ad campaign is running. This allows you to compare the effectiveness of your campaign across different regions and adjust your strategy accordingly.
Compare
Databox Inc.
HQ: Boston, MA, USA
AI-powered analytics for teams that need answers now.
Databox Inc.
HQ: Boston, MA, USA

AI-powered analytics for teams that need answers now.


Compare