
Track all of your key business metrics from one screen
GET STARTED
 Facebook Ads
CPM
Facebook Ads
CPM CPM (Cost Per Thousand Impressions) is the cost that an advertiser pays per thousand ad impressions on a social media platform such as Facebook. It is an important metric that helps to measure the effectiveness of ad campaigns and their reach.
With Databox you can track all your metrics from various data sources in one place.
Cost per Mille (CPM), also known as Cost per Thousand, is an advertising metric that represents the average cost an advertiser pays for every one thousand impressions (views) of their ad. It’s typically used to measure the cost-effectiveness of an ad campaign.
CPM is often used in comparison with other advertising metrics, such as CPC (Cost per Click) or CPA (Cost per Action), because it helps advertisers get more granular insight into the efficiency of different advertising campaigns, channels, or platforms.
Cost per Mille (CPM) is calculated by dividing the total cost of an advertising campaign by the number of impressions and then multiplying by 1,000.
Here’s the exact formula:
CPM = (Total Cost / Total Impressions) * 1000
For example, if an advertiser spends $500 for 50,000 impressions, the CPM would be
CPM = ($500 / 50,000) * 1000 = $10
This means that the advertiser is paying $10 for every one thousand impressions.
No matter which platform you run ads on, CPM will be one of the main metrics you should keep an eye on.
To help you better assess your campaign’s performance, we pulled out some benchmark data from our product that you might find useful.
Keep in mind that these numbers also highly depend on your specific industry and campaign type.
If you want to stay on top of future trends and be able to instantly compare your performance to companies just like yours (in any given industry), you can join our Benchmark Groups – it’s free for everyone!
Because the CPM rate is influenced by a variety of different factors, many marketers struggle to improve it.
But after talking to hundreds of experts and conducting dozens of reports on the topic, we’ve narrowed down some of the main tactics they use to improve their CPM:
More resources to help you improve:

Used to show a simple Metric or to draw attention to one key number.
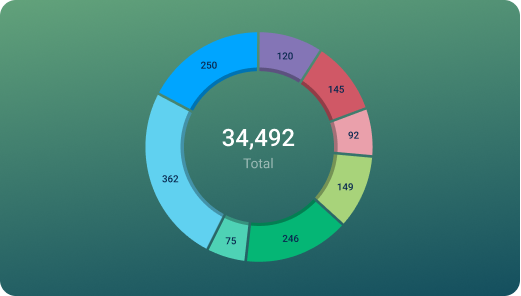
Used to illustrate numerical proportions through the size of the slices.

Used to show comparisons between values.
Databox is a business analytics software that allows you to track and visualize your most important metrics from any data source in one centralized platform.
To track CPM using Databox, follow these steps:
 Goals
Goals Scorecards
 Metric Digest
 Metric Builder
 Data Calculations
 Performance Screen
This dashboard helps you inspect every step of your e-commerce funnel so that you can quickly address problem areas.


High-level insights into Facebook Ads, Google Ads, & LinkedIn Ads

CPM, CPC, and CPA are all popular advertising metrics that are used for measuring different aspects of campaign performance.
Each metric serves a different purpose and is used to evaluate different aspects of an advertising campaign.
There are several factors that determine your campaign’s CPM rate, including:
It’s important to note that these factors can interact with each other and CPM rates can vary significantly based on their combinations.
Spotting anomalies in your CPM rate shouldn’t be an immediate reason to panic, but it’s important that you follow it up with a granular investigation and get to the root of the problem.
Here are some of the first things you should assess:
Facebook Ads
Reach refers to the total number of people who view your ad, both organically and through paid promotion. It indicates the potential audience that can be reached through your ad campaign.
Facebook Ads
Impressions refer to the number of times an ad was displayed to a user on a social media platform like Facebook. It does not necessarily mean that the user interacted with the ad, but simply that it was shown to them.
Facebook Ads
CTR (All) is a Facebook Ads metric that measures the ratio of clicks to impressions for all ad placements. It helps to evaluate the ad's relevance to users and overall performance. A higher CTR indicates better user engagement and ad performance.
Facebook Ads
CPC (All) is the average cost per click across all ad types, placements, and objectives in a Facebook Ads campaign. It shows how much an advertiser pays for each click on their ad.
Facebook Ads
CTR (Link Click-Through Rate) is a measure of the ratio between clicks and impressions on a link within a Facebook ad. It shows the effectiveness of the ad in engaging the audience and driving traffic to the intended destination.
Mailchimp
Subscribed Contacts is a metric that tracks the number of individuals who have opted-in or subscribed to receive emails from your organization through your Mailchimp account.
 SEMrush
Keywords in TOP 20 is a SEMrush metric that shows the number of keywords a website ranks for in the top 20 search engine results pages. It helps gauge a website's search visibility and SEO performance.
SEMrush
Domain Organic Keywords is a metric that shows the total number of organic keywords that a domain or website is ranking for in Google search results. It is an important indicator of a website's SEO performance and traffic potential.
Compare
Databox Inc.
HQ: Boston, MA, USA
AI-powered analytics for teams that need answers now.
Databox Inc.
HQ: Boston, MA, USA

AI-powered analytics for teams that need answers now.


Compare