
Track all of your key business metrics from one screen
GET STARTED
 Freshdesk
Companies
Freshdesk
Companies The Companies metric in Freshdesk is a count of the total number of unique companies (organizations) that have been created and interacted with in the helpdesk, including tickets, contacts, and other activities.
With Databox you can track all your metrics from various data sources in one place.
The Companies metric refers to the number of organizations or businesses that have contacted your customer support for any type of assistance within a specific period of time.
In essence, it measures the unique entities that have sought help from your support team, regardless of which channel they reached out through.
This metric encompasses data such as tickets raised, average support response time, customer satisfaction, the number of reps assigned to a company, and more.
By tracking it, you get insight into which companies interact with support teams the most, their needs, and what issues they’re facing, which allows you to fine-tune your support team’s overall approach.
To calculate the companies metric, you need to determine the total number of unique organizations or businesses that have interacted with the help desk during a specific time frame.
Keep in mind that this metric is not based on the total number of interactions or tickets but rather on the number of unique entities seeking support.
The formula is straightforward:
Companies Metric = Count of unique companies or organizations that interacted with the help desk
Let’s say a business wants to calculate its companies metric for one month and has seen these interactions during the period:
To calculate companies for this month, we need to count the unique companies. In this case, the unique companies are A, B, C, and D. Company A appeared twice in the interactions, but we only count it once since we are interested in unique entities only.
When we use the formula above, we find that the companies metric equals 4, meaning four different organizations sought help from the help desk.
If the number of unique businesses you have reaching out to is increasing, it indicates an expanding customer base and that your customer support team needs to be ready.
Ideally, your help desk should be able to meet the diverse needs of various businesses while maintaining high levels of customer satisfaction.
Let’s explore some effective support strategies to help you improve the companies metric and boost your help desk’s performance.
More resources to help you improve:

Used to show a simple Metric or to draw attention to one key number.
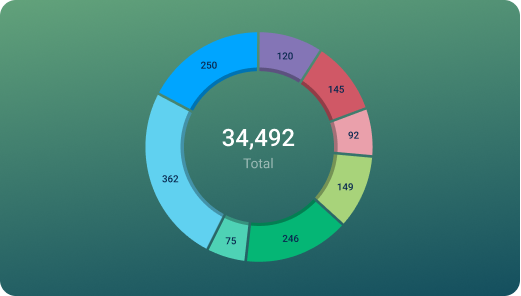
Used to illustrate numerical proportions through the size of the slices.

Used to show comparisons between values.
Databox is a business analytics software that allows you to track and visualize your most important metrics from any data source in one centralized platform.
To track Companies using Databox, follow these steps:
 Goals
Goals Scorecards
 Metric Digest
 Metric Builder
 Data Calculations
 Performance Screen
Use this customizable Freshdesk Tickets Overview Dashboard Template to track your tickets and hours to ensure you deliver the best customer experience.
Freshdesk
The Created Tickets by Priority metric displays the total number of support tickets created in Freshdesk based on their priority levels (low, medium, high, urgent).
Freshdesk
Billable Hours is a measure of the amount of time spent by an agent working on customer issues that can be charged to the customer. It helps assess the productivity and profitability of the support team while ensuring accurate billing and revenue recognition.
Freshdesk
The Open Tickets by Type metric shows the number of unresolved tickets organized by the categories or types assigned to them, providing insights into common or recurring issues.
Freshdesk
The Unresolved Tickets by Priority metric shows the number of tickets that are currently open and have not been resolved, categorized by their priority level. It provides a quick overview of the support team's workload and helps identify areas that may require attention.
Freshdesk
The Closed Tickets metric refers to the total number of support tickets that have been resolved and marked as closed within a specific time period in Freshdesk.
Freshdesk
The On Hold Tickets by Source metric tracks the number of tickets currently on hold, categorized by the channel from which they originated.
Freshdesk
On Hold Tickets by Priority is a support metric that measures the number of tickets on hold for each priority level, indicating the urgency and workload of the support team.
Freshdesk
The Unassigned Tickets by Association Type metric helps to track unassigned tickets based on the type of association with a product, category, or other factors in Freshdesk.
Compare
Databox Inc.
HQ: Boston, MA, USA
AI-powered analytics for teams that need answers now.
Databox Inc.
HQ: Boston, MA, USA

AI-powered analytics for teams that need answers now.


Compare