
Track all of your key business metrics from one screen
GET STARTED
 Matomo
Downloads
Matomo
Downloads The Downloads metric in Matomo measures the number of times files have been downloaded from your website, allowing you to better track user engagement with your downloadable content.
With Databox you can track all your metrics from various data sources in one place.
Downloads can refer to the number of times a particular file or resource has been downloaded from your website. These files can include various types of content, such as PDF documents, images, videos, audio files, software applications, and more.
Downloads can also represent the total number of app installations on your mobile phone or desktop.
More downloads equal more relationships with potential prospects who are now also one step closer to doing business with you at some point in the future.
However, prospects won’t download just anything you put on a page – you need to know how to position your files and resources to maximize the number of downloads.
Here are some expert strategies you can steal to do just that:
More resources to help you improve:

Used to show a simple Metric or to draw attention to one key number.
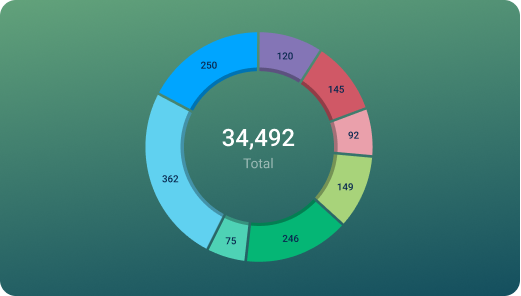
Used to illustrate numerical proportions through the size of the slices.

Used to show comparisons between values.
Databox is a business analytics software that allows you to track and visualize your most important metrics from any data source in one centralized platform.
To track Downloads using Databox, follow these steps:
 Goals
Goals Scorecards
 Metric Digest
 Metric Builder
 Data Calculations
 Performance Screen
A good number of downloads for an app can vary depending on factors such as the app’s purpose, target market, competition, and the business’s marketing efforts.
In general, achieving tens of thousands to hundreds of thousands of downloads within the first few months of launch is considered a positive indicator of a successful app with potential for further growth.
Active users and downloads are two distinct metrics used to measure the performance of an app.
Downloads represent the total number of app installations, indicating user interest.
Active users, on the other hand, are the individuals who actively engage with the app over a specific period, reflecting user retention and ongoing usage.
While downloads show initial interest, active users demonstrate an app’s sustained popularity and success.
Matomo
Visits by Device Model metric shows the number of visits to a website categorized by the type of device used, such as smartphones, tablets, desktops or laptops. It helps website owners understand how their visitors access their site and tailor their content accordingly.
Matomo
This metric shows the number of distinct visitors who accessed a website using different screen resolutions, helping determine the most common resolutions.
Matomo
The Unique Visitors by Search Engine metric in Matomo shows the number of distinct visitors who reach your website through various search engines and helps to track the effectiveness of your SEO efforts.
Matomo
Unique Visitors by Keyword is a Matomo metric that shows the number of distinct visitors who arrived at your website through a particular keyword during a specified time period.
Matomo
The Returning Visits metric counts the number of times visitors return to a website after their first visit.
Matomo
The Total Searches metric in Matomo shows the complete number of searches made on a website or app, including searches using the search bar, menu or other internal search features.
Matomo
The Unique Downloads metric in Matomo tracks the number of times a file was downloaded by unique visitors to your website/app, helping you gauge engagement with specific content.
Matomo
The Avg. Page Load time metric measures the average amount of time it takes for a web page to fully load in a user's browser. This metric can help identify performance issues that may be impacting user experience.
Compare
Databox Inc.
HQ: Boston, MA, USA
AI-powered analytics for teams that need answers now.
Databox Inc.
HQ: Boston, MA, USA

AI-powered analytics for teams that need answers now.


Compare