
Track all of your key business metrics from one screen
GET STARTED
 ProfitWell
Revenue Retention Rate
ProfitWell
Revenue Retention Rate Revenue Retention Rate measures how much recurring revenue you retain from existing customers over a period of time, after accounting for churn and upgrades/downgrades.
With Databox you can track all your metrics from various data sources in one place.
Revenue retention rate, also known as net revenue retention rate (NRR), is a financial metric that measures a company’s ability to retain and grow its revenue from existing customers over a specific period.
It also shows how much the business is generating in additional revenue from upsells, cross-sells, expansions, and renewals within its customer base.
The revenue retention rate is a crucial metric for subscription-based businesses, SaaS companies, and other businesses with recurring revenue models.
The revenue retention rate is typically calculated by taking the revenue generated from existing customers at the end of a given period (including upsells, cross-sells, and expansions) and dividing it by the revenue generated from the same group at the beginning of the period.
Then, we multiply the figure by 100 to express it as a percentage.
Here’s an exact formula you can follow:
Revenue Retention Rate = ((Ending Revenue – Expansion Revenue) / Beginning Revenue) * 100
Let’s break down these elements in the formula:
Suppose you have a SaaS company that offers a subscription service.
At the beginning of the quarter, you had 100 customers generating $100,000 in total revenue.
During the quarter, you had expansion revenue of $20,000 from upsells and cross-sells. At the end of the quarter, you had 90 customers generating $110,000 in total revenue.
Using the formula, we calculate that the revenue retention rate for this company is 90%.
Industry-specific factors, business models, customer dynamics, and growth stages all have a huge impact on when determining a good revenue retention rate for a particular company.
A commonly mentioned threshold for a strong revenue retention rate is somewhere above 100%, with the industry playing one of the biggest factors.
For example, SaaS companies typically aim for revenue retention rates in the range of 100% to 130%. This range indicates that the company is not only retaining existing customers, but also generating additional revenue from upsells, cross-sells, and expansions.
On the other hand, professional service firms like consulting or marketing agencies may have a rate ranging from 90% to 110%.
Given the nature of their business and potential project-based work, these companies strive to retain clients and secure additional revenue through project expansions or ongoing contracts.
A high revenue retention rate indicates customer satisfaction, loyalty, and the ability to generate recurring revenue, and it’s why most businesses prioritize this metric.
To improve your retention rate, you need to come up with strategies that focus on strengthening existing customer relationships and delivering ongoing value.
We spoke to hundreds of industry leaders on the topic and shortlisted some of their go-to strategies:
More resources to help you improve:

Used to show a simple Metric or to draw attention to one key number.
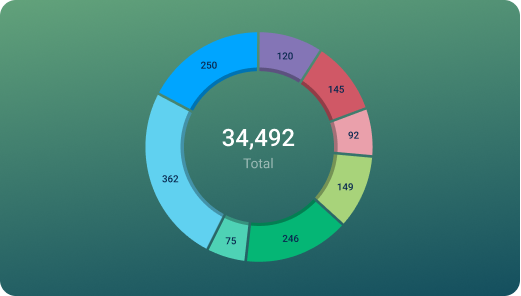
Used to illustrate numerical proportions through the size of the slices.

Used to show comparisons between values.
Databox is a business analytics software that allows you to track and visualize your most important metrics from any data source in one centralized platform.
To track Revenue Retention Rate using Databox, follow these steps:
 Goals
Goals Scorecards
 Metric Digest
 Metric Builder
 Data Calculations
 Performance Screen
Optimize leadership insights with the "SaaS MRR Drilldown for Weekly Monitoring" dashboard. Focused on key revenue metrics like Net New MRR and Net New Customers, it offers simple, numerical visualizations for a comprehensive view of your growth.
Report for SaaS revenue growth and churn management, providing detailed insights into key metrics like LTV, ARPU, MRR, churn, upgrades, and revenue retention.
Net revenue retention matters because it directly impacts the financial health and growth of a business. It provides insight into its ability to retain and expand revenue from existing customers.
Yes, net revenue retention and net dollar retention refer to the same concept. Both terms are used interchangeably to describe the financial metric that measures a company’s ability to retain and grow revenue from existing customers.
The main difference between net and gross revenue retention is in the way they account for revenue generated from existing customers.
Net revenue retention factors in expansion revenue, which includes upsells, cross-sells, and expansions, while excluding any revenue lost due to churn.
On the other hand, gross revenue retention solely considers the total revenue generated from existing customers, including both recurring revenue and expansion revenue, without subtracting revenue lost from churn.
ProfitWell
Active Customers by Plan ID shows the number of customers who are currently subscribed to each of your plans, helping you track the popularity of different offerings and identify areas that require more sales or marketing attention.
ProfitWell
The Reactivated Customers by Plan ID metric measures the number of customers who were previously inactive but have returned and resumed their subscription to a specific plan.
ProfitWell
The Reactivated Recurring Revenue metric measures the revenue generated from previously churned customers who have come back to a subscription-based business. It helps track the effectiveness of a company's re-engagement efforts.
ProfitWell
Active Trialing Customers is a metric that measures the number of customers who are currently in a trial period for a product or service.
ProfitWell
Churned Recurring Revenue Delinquent by Plan ID measures the lost revenue due to cancelled subscriptions that were not paid on time, broken down by different subscription plan types.
ProfitWell
Downgrade Rate measures the percentage of customers who switch to a lower paying plan or cancel their subscription altogether. It helps to identify the reasons for the drop in revenue and take necessary steps to improve it.
ProfitWell
This metric shows the total recurring revenue generated by each subscription plan, allowing you to analyze which plans are driving the most revenue and make informed pricing and marketing decisions.
ProfitWell
The Saas Quick Ratio by Plan ID metric gives a snapshot of a SaaS company's level of liquidity by comparing the quick ratio of different subscription plans.


