
Track all of your key business metrics from one screen
GET STARTED
 QuickBooks
Inventory
QuickBooks
Inventory Inventory metric refers to the amount of stock or products a business has on hand at any given time. It helps to track inventory levels and measure inventory turnover to optimize cash flow and profitability.
With Databox you can track all your metrics from various data sources in one place.
Inventory refers to the goods and materials that a business holds for the purpose of resale or production.
The specific items can include a variety of products, raw materials, work-in-progress goods, and finished goods that are either ready for sale or in the process of being manufactured.
The management of inventory is a critical aspect of any business, as it directly impacts the company’s financial health and operational efficiency. Proper inventory management ensures that the right quantity of items is available at the right time to meet customer demand, while minimizing carrying costs and the risk of stockouts.
To ensure efficient inventory management, businesses often use various inventory management techniques, including just-in-time (JIT) inventory, economic order quantity (EOQ), and ABC analysis, among others.
To calculate inventory, we need to consider the value of all the goods and materials that the business holds at a specific point in time.
The formula to calculate inventory is straightforward:
Inventory = Beginning Inventory + Purchases – Cost of Goods Sold (COGS) + Ending Inventory
Say a retail store wants to calculate its inventory for the year 2023 and saw these figures:
Now, let’s put the formula above into action:
Inventory = $50,000 (Beginning Inventory) + $150,000 (Purchases) – $120,000 (COGS) + $80,000 (Ending Inventory) Inventory = $160,000
In this example, the inventory for the retail store at the end of 2023 would be $160,000.
To optimize resources, minimize costs, and meet customer demands efficiently, businesses need effective inventory management.
With a well-managed inventory, you make sure that the right products are available at the right time, which significantly reduces the risk of stockouts or overstocking.
Depending on your specific business model, some inventory management strategies will be more efficient than others.
That said, we compiled a few approaches that could be useful for any business, regardless of its type or industry.
More resources to help you improve:

Used to show a simple Metric or to draw attention to one key number.
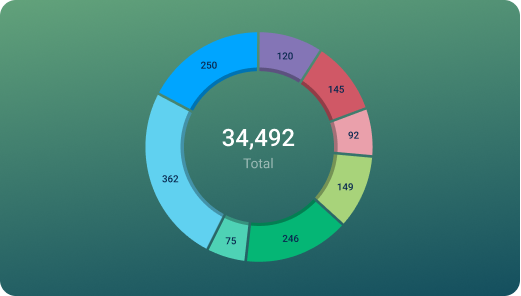
Used to illustrate numerical proportions through the size of the slices.

Used to show comparisons between values.
Databox is a business analytics software that allows you to track and visualize your most important metrics from any data source in one centralized platform.
To track Inventory using Databox, follow these steps:
 Goals
Goals Scorecards
 Metric Digest
 Metric Builder
 Data Calculations
 Performance Screen
Choosing which inventory KPIs you’re going to prioritize should be primarily based on your specific strategic goals.
Make a list of 5-8 KPIs for the beginning, and then test and refine based on your needs and operational efficiency. Tracking more KPIs might seem like a good idea, but it can actually overwhelm you and be counterproductive.
When choosing the right inventory KPIs to track, it’s also a good idea to have a chat with your warehouse manager and inventory staff to get their opinion on the most important areas.
QuickBooks
Open Invoices Amount by Customer indicates the total amount of unpaid customer invoices that are currently open and owed to the business. It is a key metric for monitoring cash flow and collections.
QuickBooks
The Unpaid Expenses (Bills) metric in QuickBooks shows the total amount of money owed to vendors or suppliers that have not yet been paid. It helps track outstanding payments and plan cash flow.
QuickBooks
Net Operating Income (Cash) is a profitability metric that reflects the income generated by a business's operations after deducting operating expenses and taxes but before deducting interest and other non-operating expenses.
QuickBooks
Net Operating Income (Accrual) is a measure of a company's profitability that subtracts operating expenses from operating revenues in a specific time period, regardless of when the cash is received or paid out.
QuickBooks
Displays current balances from linked bank and credit card accounts in QuickBooks, providing a complete snapshot of your financial position.
QuickBooks
The Balance by Bank Accounts metric is a financial measure that displays the total amount of money available in each bank account in your QuickBooks software.
QuickBooks
Net Cash Increase is a financial metric that demonstrates the amount by which cash and cash equivalents have increased during a given period. It is calculated by subtracting the cash outflows from the cash inflows.
QuickBooks
This metric records long-term debt on an accrual basis, capturing incurred obligations and interest in QuickBooks regardless of cash movement.
Compare
Databox Inc.
HQ: Boston, MA, USA
AI-powered analytics for teams that need answers now.
Databox Inc.
HQ: Boston, MA, USA

AI-powered analytics for teams that need answers now.


Compare