
Track all of your key business metrics from one screen
GET STARTED
 Shopify
Shipping
Shopify
Shipping Number of Shipping Charges associated with a Sale or return during the specified Date Range.
With Databox you can track all your metrics from various data sources in one place.
Shipping is an ecommerce metric that measures a business’s efficiency in delivering goods to buyers.
It encompasses a variety of data that directly impacts the success of an online store.
These include shipping cost as a percentage of revenue, average shipping time, shipping accuracy, on-time delivery rate, shipping return rate, shipping cost per order, and similar indicators.
To calculate the effectiveness of shipping services, there are several different performance indicators you can measure.
Now, the exact key metrics you include vary among businesses, but they generally include on-time delivery rate, shipping accuracy, shipping return rate, and customer satisfaction with shipping.
Here is one general formula you can follow:
Shipping Effectiveness = (On-Time Delivery Rate + Shipping Accuracy + Customer Satisfaction with Shipping) / 3
Again, the formula can include more or fewer metrics, depending on the specific needs and goals of the ecommerce business.
Let’s say an ecommerce store wants to evaluate its shipping effectiveness for the last month and it collected this data:
Let’s put the formula into action:
Shipping Effectiveness = (90% + 95% + 4.5) / 3 = 89.83%
In this example, the shipping effectiveness of the ecommerce store for the given period is approximately 89.83%.
This means that the shipping services are performing well, but there’s still room for improvement.
Optimizing shipping-related metrics is crucial for any ecommerce business. It contributes to more sales, better customer loyalty, and an overall positive brand reputation.
To improve your shipping services, you need to evaluate your weakest areas and start from there properly.
That said, here are some general strategies that can be useful in any ecommerce business:
More resources to help you improve:

Used to show a simple Metric or to draw attention to one key number.
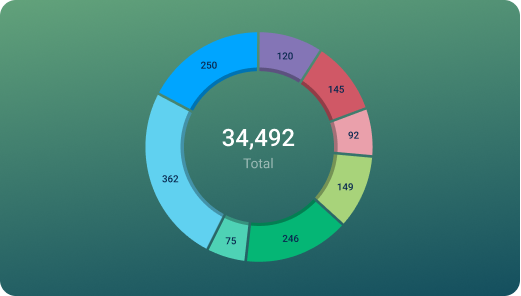
Used to illustrate numerical proportions through the size of the slices.

Used to show comparisons between values.
Databox is a business analytics software that allows you to track and visualize your most important metrics from any data source in one centralized platform.
To track Shipping using Databox, follow these steps:
 Goals
Goals Scorecards
 Metric Digest
 Metric Builder
 Data Calculations
 Performance Screen
Elevate your Shopify store with Databox's E-commerce Sales Performance template. Gain insights on Total Sales, Orders, Gross/Net Sales, and Average Order Value empower data-driven decisions, fostering growth and maximizing revenue.
Use this Shopify advanced report to share high-level and in-depth metrics of your ecommerce store performance. Present key metrics like Orders, Net Sales, New Customers, and more.
In shipping, a KPI is a measurable metric used to evaluate the efficiency of the shipping process.
Common shipping KPIs include on-time delivery rate, shipping accuracy, shipping cost as a percentage of revenue, average shipping time, and customer satisfaction with shipping.
Shopify
Equates to Product Selling Price x Ordered Quantity on during specified Date Range. Gross Sales does not include Discounts, Returns, Taxes, or Shipping.
Shopify
Equates to product Selling Price x Ordered Quantity during the specified Date Range split up by New vs Returning Customers.
Shopify
Net sales is the total sales revenue generated by a business after accounting for returns, discounts, and other deductions. It is a key metric to measure a company's profitability.
Shopify
The Orders metric on Shopify represents the total number of purchases completed by customers, providing insights into sales performance, customer behavior and trends.
Shopify
The Discounts by Billing Country metric shows the total amount of discounts applied to orders based on the country where the customer's billing address is located.
Shopify
This metric allows Shopify store owners to track the effectiveness of their discount campaigns based on the location of the customer's billing city. It provides insights on which cities are responding well to discounts and can aid in targeting future promotions.
Shopify
Returns metric measures the number and percentage of orders that are returned by customers. This helps to track customer satisfaction and identify potential issues with product quality or delivery.
Shopify
The Quantity by Product Vendor metric indicates the total number of units sold for each product vendor in a given time period. It helps determine which vendors are most successful and which products are driving sales.
Compare
Databox Inc.
HQ: Boston, MA, USA
AI-powered analytics for teams that need answers now.
Databox Inc.
HQ: Boston, MA, USA

AI-powered analytics for teams that need answers now.


Compare