
Track all of your key business metrics from one screen
GET STARTED
 Xero
Gross Profit Margin
Xero
Gross Profit Margin Gross Profit Margin is a financial metric that measures how much profit a company makes after deducting the cost of goods sold from its revenue.
With Databox you can track all your metrics from various data sources in one place.
Gross profit margin is a financial metric that showcases the profitability of a company’s core operations by analyzing the relationship between its revenue and the cost of goods sold.
It’s the percentage of revenue that remains after deducting the direct costs associated with producing or purchasing the goods or services sold by the company.
To calculate your gross profit margin, you need two key figures – revenue and the cost of goods sold.
Once you have these numbers, you can use the following formula:
Gross Profit Margin = (Gross Profit / Revenue) * 100
For example, let’s say a company generates $500,000 in revenue and incurs $250,000 as the cost of goods sold.
The gross profit for that company would be $250,000. Now, we can apply the formula:
Gross Profit Margin = ($250,000 / $500,000) * 100
In this example, we find that the gross profit margin is 50%.
Unfortunately, the only correct answer to what a good gross profit margin is – it depends.
Because there are so many factors (e.g., industry, size, business model) that influence your specific gross profit margin, it can be hard to pinpoint what’s good without digging deep into your performance.
That said, we pulled out some specific numbers from our product that you might find useful.
A good gross profit margin for SaaS and B2B companies in Xero is from 60% to 80%, according to Xero Financial KPIs for SaaS and B2B Companies.
A good gross profit margin for all companies in QuickBooks is around 67%, according to QuickBooks Benchmarks for All Companies.
If you want to stay on top of future trends and be able to instantly compare your performance to companies just like yours (in any given industry), you can join our Benchmark Groups – it’s free for everyone!
Depending on your industry and specific business model, some strategies will work better than others.
And while one-size-fits-all strategies don’t really exist, there are some tactics that industry experts in most industries turn to in their own businesses:
More resources to help you improve:

Used to show a simple Metric or to draw attention to one key number.
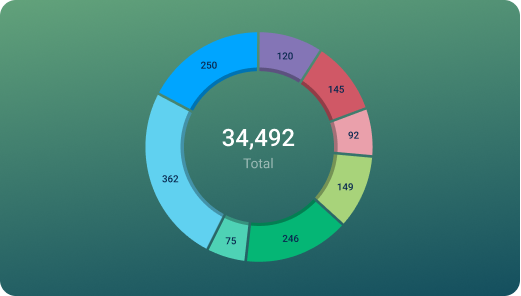
Used to illustrate numerical proportions through the size of the slices.

Used to show comparisons between values.
Databox is a business analytics software that allows you to track and visualize your most important metrics from any data source in one centralized platform.
To track Gross Profit Margin using Databox, follow these steps:
 Goals
Goals Scorecards
 Metric Digest
 Metric Builder
 Data Calculations
 Performance Screen
The Xero Profit & Loss (P&L) Overview dashboard provides a detailed view of income, expenses, gross profit, and net profit trends. It includes net profit breakdowns by type and visual comparisons of revenue vs. expenses over time.
This report gives a snapshot of financial results using Xero data on income, expenses, cash flow, balance sheet, and overall financials, supporting informed financial decisions.
Gross margin is the percentage of revenue remaining after deducting the cost of goods sold, while net margin is the percentage of revenue remaining after subtracting all expenses, including operating expenses, interest, and taxes.
Gross margin is a percentage that represents the proportion of revenue remaining after deducting the cost of goods sold, while gross profit is the actual monetary value.
Xero
Income is the sum of all revenue earned by a business during a defined period of time, including sales, services, and other sources of income.
Xero
The Profit and Loss by Subtype metric in Xero allows users to view their company's profit and loss broken down by specific subcategories, providing a detailed analysis of the financial performance of each area of the business.
Xero
Gross Profit (Budget) is a financial metric that tracks the amount of revenue a company generates after deducting the cost of goods sold. It helps businesses assess their profitability by comparing the budgeted gross profit to actual results.
Xero
Total Expenses (Budget) is a financial metric that represents the total amount of money allocated for expenses during a specific period, as planned or forecasted in the budget. It helps to monitor the actual expenses and ensure that they align with the company's financial goals and objectives.
Xero
The Payments by Contact metric in Xero tracks the total amount of payments made by each contact (customer or supplier), providing valuable insights into their spending or revenue patterns.
Xero
Direct Costs metric refers to the expenses incurred specifically for the production of goods or services. These costs are directly tied to the production process and can include raw materials, labor costs, and other expenses directly related to production. #Xero #DirectCosts
Xero
The Average Creditors Days metric is a measure of how long it takes a business to pay its suppliers. It is calculated by dividing accounts payables by the average daily cost of goods sold and is a key indicator of a company's cash flow management and supplier relationships.
Xero
Cost of Sales is a financial metric that calculates the sum of all costs incurred in the production or sale of goods or services. This metric helps businesses understand their overall expenses and monitor changes in their cost structure over time. By tracking this metric, businesses can identify areas where costs can be reduced or optimized, and make informed decisions about their pricing, production, and sales strategies.
Compare
Databox Inc.
HQ: Boston, MA, USA
AI-powered analytics for teams that need answers now.
Databox Inc.
HQ: Boston, MA, USA

AI-powered analytics for teams that need answers now.


Compare