
Track all of your key business metrics from one screen
GET STARTED
 Google Ads
Cost
Google Ads
Cost Cost is the amount of money you have spent on your Google AdWords campaign. It can be viewed as a total cost or broken down by ad, keyword, or other customizable factors.
With Databox you can track all your metrics from various data sources in one place.
Cost is a metric that’s used to measure the financial investment made in an advertising campaign or marketing effort.
It provides insights into the expenses incurred to execute the advertising strategy and reach the desired audience. Understanding the cost associated with advertising is essential for businesses to evaluate the efficiency and profitability of their campaigns.
But keep in mind that a low cost doesn’t always guarantee success. You need to analyze it alongside other KPIs like conversion rate, return on ad spend (ROAS), and customer lifetime value (CLV).
Calculating the cost metric comes down to measuring the financial investment made in an advertising campaign.
There’s a variety of ways you can calculate the cost, depending on the specific metric you want to measure.
Some of the popular examples include cost per click (CPC), cost per thousand impressions (CPM), cost per lead (CPL), and cost per acquisition (CPA).
Each of these metrics is calculated using different formulas.
There’s no one good cost amount that each business should follow. The most important thing is that you’re making more than what you’re spending.
Now, there are a lot of different factors that will determine how much you need to spend to see positive results – your industry, business model, advertising objective, geographical location, and a few more.
But the most important factor is the advertising platform you use.
Each platform comes with its own benefits and challenges, and they’re not all suitable for each type of business.
For example, ecommerce stores will likely see a better cost/profit ratio on Facebook than on LinkedIn, which won’t be the case with a B2B fintech platform.
That said, we pulled out some interesting cost benchmarks from our product that you might find useful, divided by advertising platforms.
A good cost amount on Google Ads is around $2,000 a month, according to Google Ads Benchmarks for All Companies.
A good cost amount on TikTok Ads is around $1,000 a month, according to TikTok Ads Benchmarks for All Companies.
A good cost amount on Facebook Ads is around $1,500 a month, according to Facebook Ads Benchmarks for All Companies.
A good cost amount on Microsoft Ads is from $1,000 to $2,500 a month, according to Microsoft Advertising Benchmarks for All Companies.
A good cost amount on LinkedIn Ads is around $1,500 a month, according to LinkedIn Ads Benchmarks for All Companies.
If you want to stay on top of future trends and be able to instantly compare your performance to companies just like yours (in any given industry), you can join our Benchmark Groups – it’s free for everyone!
If there’s one thing universal about advertising costs among all businesses, it’s that everyone is constantly looking for ways to up their ROI.
But regardless of which advertising platform you use, this is no easy feat.
To make more money on ad platforms, you need to be constantly testing and refining different strategies in all areas (optimizing ad spend, fine-tuning audience targeting, creating compelling content, etc.).
We talked to hundreds of experts in the industry on this topic over the last few years and compiled a few of their go-to strategies that you can steal:
More resources to help you improve:

Used to show a simple Metric or to draw attention to one key number.
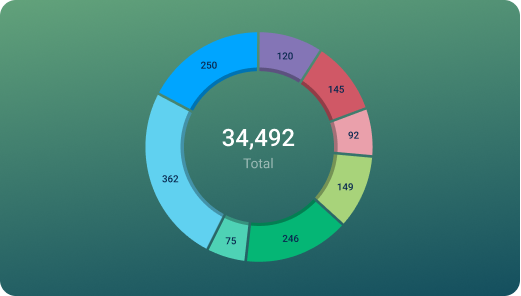
Used to illustrate numerical proportions through the size of the slices.

Used to show comparisons between values.
Databox is a business analytics software that allows you to track and visualize your most important metrics from any data source in one centralized platform.
To track Cost using Databox, follow these steps:
 Goals
Goals Scorecards
 Metric Digest
 Metric Builder
 Data Calculations
 Performance Screen

The Facebook Ads, Google Ads & Google Analytics 4 template allows you to monitor your Facebook and Google campaigns at the same time to track your progress and areas to improve upon.

Analyze ad spend, conversions, ROAS, and more across Google, Facebook, and LinkedIn Ads. Built for CMOs, performance marketers, and growth teams to optimize campaign performance and maximize ROI.

Use this Google Ads advanced report to share high-level and in-depth metrics of your Google Ads performance. Present key insights like CPC, Conversion Rate, Keyword Drilldown, and more.
LinkedIn Ads
Conversions is a metric that measures the number of times a desired action is completed on a LinkedInAds campaign, such as filling out a form or making a purchase. It helps advertisers track the effectiveness of their ad campaigns in driving valuable actions.
 CallRail
Total Calls is a CallRail metric that tracks the total number of calls received through your CallRail tracking numbers.
Google Analytics 4
Sessions are a collection of interactions that take place on a website within a specified time frame. Each session can include multiple pageviews, events, and other actions taken by a user.
Google Analytics 4
Engaged Sessions is a Google Analytics 4 metric that measures the number of sessions where users engaged with the website or app. Engagement is defined as the amount of time spent actively interacting with the content, such as scrolling, clicking, or watching videos.
Google Analytics 4
The Active Users metric in Google Analytics 4 counts the number of unique users who have engaged with your website or app during a specific time period.
Google Analytics 4
The Event Count metric in Google Analytics 4 measures the total number of times a specific event has occurred on your website or app, giving you insight into user engagement and behavior.
Google Analytics 4
New Users metric represents the number of unique, first-time users to a website or app during a specific time period. It helps measure the growth of a business's audience and identify opportunities for acquisition and retention strategies.
Google Analytics 4
Total Users metric counts the number of unique users who visited a website or app within a given time period, regardless of how many times they visited or actions they took.
Google Ads
Clicks is a metric that measures the number of times users click on an ad and are directed to the advertiser's website or landing page. It helps advertisers gauge ad performance and user engagement.
Google Ads
Impressions is a metric in Google Adwords that refers to the number of times your ad has been displayed to potential customers on the Google search results page or on websites and apps that are part of the Google Display Network.
Google Ads
The Conversions metric measures the number of desired actions taken by users on your website after clicking on your ad, such as completing a purchase or filling out a form.
Google Ads
The All Conversions metric is a measure of all desired actions taken by users on your website after clicking an ad, including purchases, form submissions, and phone calls.
Google Ads
Avg. CPC stands for Average Cost Per Click, which is the average amount of money an advertiser pays each time a user clicks on one of their ads. It is a key metric in Google AdWords and helps advertisers evaluate the effectiveness of their ad campaigns.
 HubSpot Marketing
New Visitor Sessions measures the number of unique users who visit your website for the first time within a specified time period.
HubSpot Marketing
The Sessions metric in Hubspot measures the number of times a user interacts with a website within a specific period. It includes all page views, clicks, and other actions taken by the user during that time.
HubSpot Marketing
Page Views is a metric on HubSpot that measures the number of times a web page has been viewed by visitors. This metric is important in determining the popularity and engagement of a webpage.
Show all related metrics...
Compare
Databox Inc.
HQ: Boston, MA, USA
AI-powered analytics for teams that need answers now.
Databox Inc.
HQ: Boston, MA, USA

AI-powered analytics for teams that need answers now.


Compare