
Track all of your key business metrics from one screen
GET STARTED
 Google Analytics 4
Conversions
Google Analytics 4
Conversions Conversions is a performance metric that measures the number of times visitors complete a desired action on your website, such as a purchase, form submission, or app installation. It helps you track the effectiveness of your marketing campaigns and optimize your website to increase conversions.
With Databox you can track all your metrics from various data sources in one place.
Conversions represent the number of users who have taken a desired action on a website or within a specific marketing campaign.
Each business defines what it will count as a conversion and this can include making a purchase, filling out a form, signing up for a newsletter, downloading an app, or similar.
The pre-step to calculating conversions is determining a conversion goal – the specific action that you’ll consider a conversion.
Once you have that, you can calculate your conversion rate following this formula:
Conversion Rate = (Number of Conversions / Total Number of Visitors) * 100
For example, if you ran a lead gen campaign and you had 50 signups from 1,000 visitors, the conversion rate would be 5%.
Depending on your industry, business model, marketing objectives, and the specific conversion action you’re measuring, the concept of a “good” number of conversions can vary widely.
That said, we pulled out some benchmark data from our product that you can use to compare your performance on different networks:
Again, if you’re numbers aren’t in line with this benchmark, it’s not a reason to panic. There can be large fluctuations between business models, campaigns, and the types of conversions.
If you want to stay on top of future trends and be able to instantly compare your performance to companies just like yours (in any given industry), you can join our Benchmark Groups – it’s free for everyone!
Your conversions are a direct indicator of your campaign’s performance, which means they should be at the top of a business’s “metrics to optimize” list.
Now, while there aren’t any magic bullets when it comes to increasing conversions, swiping what top-tier marketers are doing comes close enough.
We talked to hundreds of leading marketers in different industries and here are some of their go-to tactics for improving conversions:
More resources to help you improve:

Used to show a simple Metric or to draw attention to one key number.
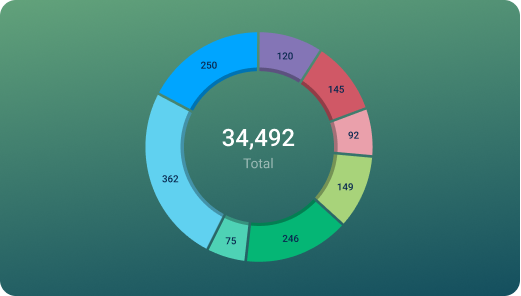
Used to illustrate numerical proportions through the size of the slices.

Used to show comparisons between values.
Databox is a business analytics software that allows you to track and visualize your most important metrics from any data source in one centralized platform.
To track Conversions using Databox, follow these steps:
 Goals
Goals Scorecards
 Metric Digest
 Metric Builder
 Data Calculations
 Performance Screen
This report combines search, user data plus goals from Google Analytics on your business website and also phone calls / actions from Google My Business.

Focus in on the metrics that matter from your Google Analytics 4 account. Measure the key outcomes that your website was designed to create, as well as the leading indicators that help pinpoint where your greatest opportunities lie.
Use this Google Analytics 4 report to analyze and share insights into website engagement, audience behavior, and content marketing efforts.
Your conversion rate is based on the efficiency of multiple elements on your website or campaign, and the way they function with one another.
Some of the main factors include website design, user experience, CTA button, landing page messaging, website load time, brand credibility, value proposition, and more.
The number of conversions you get is one of the best indicators of how effective your marketing efforts are. It shows you the percentage of visitors that take the desired action, which ultimately determines the success of your business goals.
The best way to track your conversion rate is by using a business analytics platform like Databox.
Relying on manual reporting and data analytics from native tools isn’t enough to get the full picture of your performance.
With Databox, you can stay on top of your conversions in real time and all the related metrics that influence it. In a matter of minutes, you can create comprehensive dashboards that showcase all of your key performance points.
Google Analytics 4
Sessions are a collection of interactions that take place on a website within a specified time frame. Each session can include multiple pageviews, events, and other actions taken by a user.
Google Analytics 4
The Session Conversion Rate is a metric that measures the percentage of sessions on a website that result in a conversion, such as a purchase or form submission. It helps businesses understand how effective their website is at driving conversions.
Google Analytics 4
The percentage of Users who triggered any Conversion Event.
Google Analytics 4
The Transactions metric in Google Analytics 4 tracks the number of successful purchases made on your website or app and allows you to measure the monetary value of those transactions. It gives you insights into your conversion rates, revenue, and e-commerce performance.
Google Analytics 4
The Ecommerce Purchases metric measures the total number of completed purchases made on an ecommerce website, including the quantity of items purchased and revenue generated.
Google Analytics 4
Engaged Sessions is a Google Analytics 4 metric that measures the number of sessions where users engaged with the website or app. Engagement is defined as the amount of time spent actively interacting with the content, such as scrolling, clicking, or watching videos.
Google Analytics 4
The Active Users metric in Google Analytics 4 counts the number of unique users who have engaged with your website or app during a specific time period.
Google Analytics 4
The Event Count metric in Google Analytics 4 measures the total number of times a specific event has occurred on your website or app, giving you insight into user engagement and behavior.
Google Analytics 4
The Event Count per User metric measures the total number of events triggered by a unique user within a selected time frame. It helps track user engagement and behavior on a website or app.
Google Analytics 4
New Users metric represents the number of unique, first-time users to a website or app during a specific time period. It helps measure the growth of a business's audience and identify opportunities for acquisition and retention strategies.
Google Analytics 4
Purchase Revenue is a metric that shows the total amount of revenue generated from online purchases made on a website or app.
Google Analytics 4
Views is a metric in Google Analytics 4 that tracks the number of times a particular page or screen is viewed by a user on your website or app.
Google Analytics 4
Total Revenue is a key performance indicator that measures the overall amount of money generated by sales of products or services over a specific period of time.
Google Analytics 4
Total Users metric counts the number of unique users who visited a website or app within a given time period, regardless of how many times they visited or actions they took.
 Pipedrive CRM
Deals started refers to the total number of new deals created in a given time frame. It's a crucial metric in Pipedrive that helps measure the effectiveness of the sales team's prospecting and pipeline-building efforts.
 HubSpot Marketing
The New Contacts (w/o Offline Source) metric in Hubspot measures the number of new contacts acquired through online sources, such as website visits, social media, or email marketing campaigns, excluding any offline sources such as trade shows or direct mail.
HubSpot Marketing
New Visitor Sessions measures the number of unique users who visit your website for the first time within a specified time period.
HubSpot Marketing
The Sessions metric in Hubspot measures the number of times a user interacts with a website within a specific period. It includes all page views, clicks, and other actions taken by the user during that time.
HubSpot Marketing
Avg. Session Length is a metric that measures the average duration of a user's visit to a website, indicating how engaged they are with the content.
HubSpot Marketing
Page Views is a metric on HubSpot that measures the number of times a web page has been viewed by visitors. This metric is important in determining the popularity and engagement of a webpage.
 Facebook Ads
Purchases is a metric in Facebook Ads that measures the number of completed transactions on your website, app or Facebook page as a result of your ad. It is a key measure of the advertising ROI and can be used to optimize your ad campaigns for increased sales and revenue.
Facebook Ads
Purchases Conversion Value is a metric that shows the total value of the purchases made by people who clicked on your Facebook ads. It helps you track the revenue generated by your ads and optimize your campaigns accordingly.
Facebook Ads
The Add to Cart metric measures the number of times users have clicked on the "Add to Cart" button on an ad or product page, indicating their interest in purchasing a product.
Facebook Ads
The Ads to Cart Conversion Value is a metric that measures the total amount of revenue generated from purchases made by users who added items to their cart after clicking on your Facebook ad.
 Google Search Console
Clicks metric in Google Search Console refers to the number of times users clicked on your website's organic search result when it appeared in search results.
Google Search Console
CTR, or click-through rate, is the ratio of clicks to impressions of a webpage or ad, expressed as a percentage. It measures the effectiveness of a website or ad in getting clicks from potential users.
 CallRail
Total Calls is a CallRail metric that tracks the total number of calls received through your CallRail tracking numbers.
 WooCommerce
Total Sales is a metric that represents the overall revenue generated from all products or services sold by a business within a specific period.
WooCommerce
Net Sales represents the total revenue generated from the sale of products or services, less any discounts, returns, or refunds.
WooCommerce
The Orders Placed metric indicates the total number of orders that have been successfully placed by customers on an online store.
 Stripe
New Customers metric represents the number of unique customers who have made their first payment or transaction with your business within a given time period.
 Google Ads
The Conversions metric measures the number of desired actions taken by users on your website after clicking on your ad, such as completing a purchase or filling out a form.
Google Ads
The All Conversions metric is a measure of all desired actions taken by users on your website after clicking an ad, including purchases, form submissions, and phone calls.
Google Ads
The Conversion Value metric represents the total value of all conversions completed by an advertiser during their ad campaign, taking into account the assigned value of each conversion. It is a measure of the success and ROI of the campaign.
 HubSpot CRM
The Tasks Completed metric in Hubspot CRM shows the number of tasks that have been marked as completed by team members within the specified time period. This provides insight into individual and team productivity and helps track progress towards goals and deadlines.
Show all related metrics...
Compare
Databox Inc.
HQ: Boston, MA, USA
AI-powered analytics for teams that need answers now.
Databox Inc.
HQ: Boston, MA, USA

AI-powered analytics for teams that need answers now.


Compare