
Track all of your key business metrics from one screen
GET STARTED
 Stripe
Downgrades
Stripe
Downgrades The Downgrades metric measures the number of customers who have shifted from a higher-priced subscription plan to a lower-priced one within a specified timeframe.
With Databox you can track all your metrics from various data sources in one place.
A downgrade is when a customer moves from a higher subscription level to a lower one, resulting in a loss of revenue for the business.
This metric is crucial for subscription-based businesses as it could indicate a problem with the service, such as high prices or lack of perceived value at higher plan tiers.
You can calculate your downgrade ratio by dividing the number of customers who have switched to lower-tier subscription plans by the total number of customers.
Here’s the exact formula:
Downgrades = Number of customers who downgraded / Total number of customers
Let’s say you have a software company with 1000 subscribers. During a specific period, 15 customers downgraded their subscription plans.
Upgrades = 15 / 1000
This leaves us with a 1.5% downgrade ratio for the specific time period.
What Is an Acceptable Downgrade Ratio
The acceptable downgrade ratio can vary depending on the pricing structure, the business model, the company’s specific goals, and a variety of similar factors.
But as a general rule of thumb, a downgrade ratio of below 2% is something many businesses find acceptable.
Just remember that an acceptable downgrade ratio is not a fixed number, but a dynamic metric that changes to your specific circumstances.
Regular monitoring and analysis of downgrade ratios, along with customer feedback, will help you determine what is acceptable for your own organization and help you make more informed decisions going forward.
Reducing the number of downgrades and making sure your customers are satisfied with the service is a critical aspect of maintaining and growing your business’s revenue.
Let’s take a look at some specific tactics that industry leaders employ in their companies when trying to reduce downgrades:
More resources to help you improve:

Used to show a simple Metric or to draw attention to one key number.
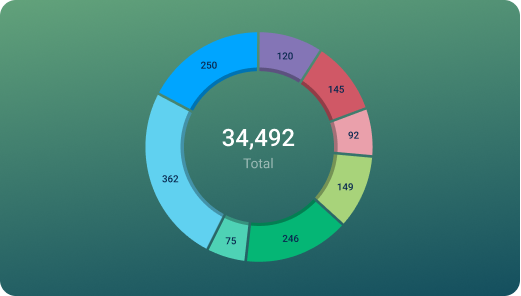
Used to illustrate numerical proportions through the size of the slices.

Used to show comparisons between values.
Databox is a business analytics software that allows you to track and visualize your most important metrics from any data source in one centralized platform.
To track Downgrades using Databox, follow these steps:
 Goals
Goals Scorecards
 Metric Digest
 Metric Builder
 Data Calculations
 Performance Screen
The Stripe SaaS MRR Growth dashboard tracks MRR, net new customers, churn rate, and revenue trends. It provides insights into MRR breakdowns (new, upgrade, churn MRR), helping SaaS businesses optimize subscription growth and retention.
Monitor key revenue metrics like MRR, ARR, and churn with live data from Stripe. Built for SaaS leaders, revenue teams, and growth strategists to drive smarter decisions.
One of the main reasons for downgrades is cost – customers may feel they aren’t getting enough value for their money. Or in some other cases, they may not fully use or understand the features of higher-tier plans.
Other factors that can lead to downgrades include business changes like budget cuts or downsizing, issues with customer service, and dissatisfaction with product performance.
To keep your users from downgrading their plans, you need to consistently demonstrate the value of your higher-tier services.
Try to regularly check in with your customers to catch potential problems before they turn into reasons for a downgrade.
Educate your users about how they can benefit from your advanced features and ask them if they want 1-on-1 assistance to learn the ropes around it.
There is a variety of different ways you can reduce the number of upgrades, but talking to your customers and getting their direct feedback on what they think (and acting on it) is at the core of each strategy.
Stripe
Refunds metric measures the amount of money refunded to customers for a specific period of time. It helps businesses understand how much revenue they have lost due to refunds and identify areas for improvement in their product or service.
Stripe
Available Balance metric in Stripe represents the funds that are currently available for immediate withdrawal or payout to connected accounts.
Stripe
Application Fees is a feature that allows platform owners to charge a fee on top of payment transactions made by their connected accounts. This helps them earn revenue on top of the usage of the Stripe platform.
Stripe
New Monthly Recurring Revenue generated by each plan offered by a business during a specific time period.
Stripe
Churned MRR measures the loss or decline in revenue generated from existing customers due to cancellations, downgrades, or pricing changes.
Stripe
Churned Customers (Delinquent) metric measures the number of customers who fail to pay recurring payments and cancel their subscription. This helps to track the loss of revenue due to customer attrition.
Stripe
MRR Upgrades measures the total increase in Monthly Recurring Revenue (MRR) from existing customers who upgraded to a higher-priced subscription plan.
Stripe
MRR Upgrades by New Plan Name is a metric that shows the amount of monthly recurring revenue generated from customers upgrading to a new pricing plan, organized by the specific plan they upgraded to.
Compare
Databox Inc.
HQ: Boston, MA, USA
AI-powered analytics for teams that need answers now.
Databox Inc.
HQ: Boston, MA, USA

AI-powered analytics for teams that need answers now.


Compare