
Track all of your key business metrics from one screen
GET STARTED
 Stripe
Upgrades
Stripe
Upgrades Upgrades is a Stripe metric that measures the increase in revenue generated by customers who have upgraded to a higher pricing plan or subscription level.
With Databox you can track all your metrics from various data sources in one place.
Upgrades refer to the process of customers moving from one subscription tier to a higher or more advanced one, where they will gain access to additional features and functionality.
Upgrades are an essential metric for SaaS companies as they indicate the growth of customer accounts. They signify that customers see value in the product and are willing to invest more to gain greater benefits.
Tracking this metric is crucial for measuring expansion revenue, understanding customer behavior, and identifying opportunities for upselling.
To calculate upgrades, we need to divide the number of customers who upgraded their subscriptions by the total number of customers. This way, we can get the exact percentage.
Here’s the formula you can follow:
Upgrades = Number of customers who upgraded / Total number of customers
Let’s say you have a SaaS company with 500 customers. During a specific period, 50 customers upgraded their subscription plans.
Upgrades = 50 / 500
This leaves us with a 10% upgrade ratio.
A good upgrade ratio can vary depending on several factors, such as your target market, pricing model, and the specific stage of your SaaS business.
However, as a general guideline, a healthy upgrade ratio typically falls within the 10% to 30% range.
It’s important to note that a high upgrade ratio doesn’t necessarily mean it’s always better. Sometimes, a high ratio could indicate that you’re not initially capturing enough value in your lower-tier plans.
The best thing you can do is continuously monitor your historical data, track industry benchmarks, and evaluate your performance in relation to your specific business context to get a real sense of whether your numbers are good.
To increase the number of upgrades for your product, you need to come up with effective strategies that will encourage your customers to move to higher-tier plans.
This can include offering additional value, highlighting the benefits of advanced features, and providing a seamless upgrade experience.
But if you’re looking for something more specific, here are some of the strategies that leading industry experts use in their businesses:
More resources to help you improve:

Used to show a simple Metric or to draw attention to one key number.
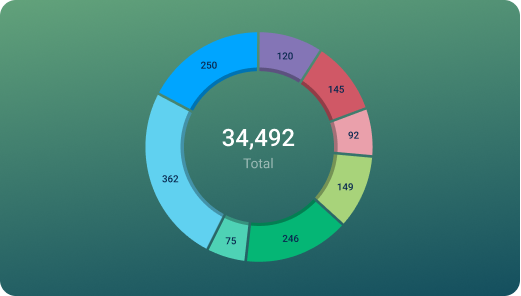
Used to illustrate numerical proportions through the size of the slices.

Used to show comparisons between values.
Databox is a business analytics software that allows you to track and visualize your most important metrics from any data source in one centralized platform.
To track Upgrades using Databox, follow these steps:
 Goals
Goals Scorecards
 Metric Digest
 Metric Builder
 Data Calculations
 Performance Screen
The Stripe SaaS MRR Growth dashboard tracks MRR, net new customers, churn rate, and revenue trends. It provides insights into MRR breakdowns (new, upgrade, churn MRR), helping SaaS businesses optimize subscription growth and retention.
This report is designed for SaaS leaders, providing in-depth analysis of MRR, customer churn, and revenue growth metrics. This dynamic overview integrates key performance indicators such as ARPU, LTV, customer retention, and MRR breakdowns.
Stripe
Successful Charges metric measures the total number of completed transactions that were successfully charged using Stripe's payment processing system.
Stripe
MRR (excl. Canceled Subscriptions) by Plan Name is a metric that measures the total Monthly Recurring Revenue generated by each subscription plan offered by a business excluding canceled subscriptions. It helps businesses assess the popularity and profitability of different subscription plans, and make data-driven decisions on pricing, promotions and product offering.
Stripe
Discounts (excl. Canceled Subscriptions) is a metric that reflects the total revenue reduction due to discounts applied to monthly recurring revenue (MRR) of a business through Stripe.
Stripe
Churned MRR measures the loss or decline in revenue generated from existing customers due to cancellations, downgrades, or pricing changes.
Stripe
Open Invoices is a metric that measures the total number of invoices that have been issued to customers but have not been marked as paid or voided.
Stripe
Overdue Invoices Amount metric in Stripe tracks the total amount of unpaid invoices that are past their due date, providing an overview of the outstanding balance that customers owe.
Stripe
Discounts is a metric that reflects the total revenue reduction due to discounts applied to monthly recurring revenue (MRR) of a business through Stripe.
Stripe
Trial Conversion Rate measures success in converting trials to active subscriptions over a rolling 30-day period, excluding today.
Compare
Databox Inc.
HQ: Boston, MA, USA
AI-powered analytics for teams that need answers now.
Databox Inc.
HQ: Boston, MA, USA

AI-powered analytics for teams that need answers now.


Compare