
Track all of your key business metrics from one screen
GET STARTED
 Xero
Operating Expenses
Xero
Operating Expenses Operating Expenses metric in Xero represents the sum of all expenses incurred by a business during its normal operations, including salaries, rent, utilities, and other overhead costs.
With Databox you can track all your metrics from various data sources in one place.
The total operating expenses metric refers to the sum of all expenses incurred by a business in its day-to-day operations.
These expenses are necessary to keep the business running and typically include things like the cost of goods sold, administrative expenses, depreciation, amortization, rent, research and development expenses, insurance, maintenance and repairs, professional services, and others.
It’s important to note that the specific categories and expense types can vary depending on the nature of the business and industry.
To calculate the total operating expenses for a business, you need to gather the necessary financial information from the income statement.
Simply put, the total operating expenses are calculated by summing up all the expenses incurred in the ordinary course of business operations.
You can use this formula:
Total Operating Expenses = Direct Expenses + Indirect Expenses + Other Operating Expenses
Direct expenses are those that are directly associated with the production or acquisition of goods or services.
Indirect expenses are expenses incurred in support of the overall business operations but not directly tied to the production process.
Other operating expenses refer to any additional operating expenses that are not included in the direct or indirect expenses categories.
Now, let’s say a company saw these expenses during a specific time frame:
To calculate the total operating expenses, we sum up all these expenses:
Total Operating Expenses = $200,000 + $100,000 + $20,000 + $15,000 + $10,000 + $25,000 + $5,000 + $8,000 + $12,000 + $7,000
This way, we find that the total operating expenses for this company are $402,000.
Keep in mind that this is a simplified example. In practice, the income statement and calculation of operating expenses will usually involve more line items and complexities.
As a general rule of thumb, a lower operating ratio indicates better operational efficiency for the business.
But the ideal ratio varies across industries due to major differences in business models, market dynamics, cost structures, and similar factors.
For example, in the healthcare Industry, the total operating expense ratio varies depending on the type of healthcare provider (hospital, clinic, etc.) and the mix of services they offer. It usually ranges from 70% to 90% of total revenue.
For the financial services industry, the total operating expense ratio can be influenced by factors such as regulatory requirements, staffing levels, and technology investments. Here, it typically ranges from 50% to 70% of total revenue.
It’s important to note that these ranges are general estimates and cannot be applied to every business within each industry.
You should analyze your specific operating expense ratio in conjunction with other financial metrics and industry benchmarks to get a better understanding of performance.
Since total operating costs have a direct impact on a company’s bottom line, business owners are constantly testing out new strategies to try and identify potential opportunities to minimize them.
Over the years, we talked to some of the leading industry experts and compiled a list of several methods they use to reduce total operating expenses in their businesses:
More resources to help you reduce total operating expenses:

Used to show a simple Metric or to draw attention to one key number.
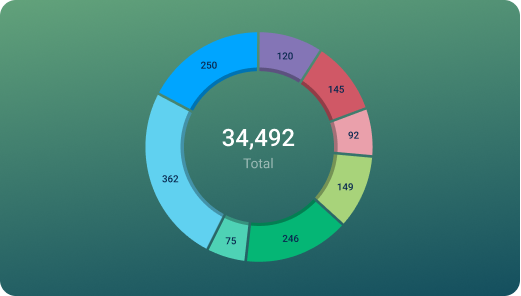
Used to illustrate numerical proportions through the size of the slices.

Used to show comparisons between values.
Databox is a business analytics software that allows you to track and visualize your most important metrics from any data source in one centralized platform.
To track Operating Expenses using Databox, follow these steps:
 Goals
Goals Scorecards
 Metric Digest
 Metric Builder
 Data Calculations
 Performance Screen
Optimize e-commerce leadership with our WooCommerce + Xero dashboard. Monitor Sales Funnel, Performance, Profit & Loss, Revenue, Expenses, and Cash Flow metrics for actionable insights.

The best way to track your operating expenses and stay on top of them in real-time is by using specialized business analytics software like Databox.
This way, you can compile all of your total operating expenses alongside key financial KPIs in one place and create professional dashboards that are easy to read and understand.
With 100+ integrations, you can connect QuickBooks or any other accounting software you may use.
Operating expenses are the costs incurred in the day-to-day operations of a business and they’re directly related to its core activities. These expenses are essential for running the business and generating revenue, such as wages, rent, utilities, and raw materials.
On the other hand, non-operating expenses are not directly tied to the core operations of the business. They are incidental and include items like interest expenses, gains or losses from investments, and one-time charges or write-offs.
Xero
Operating Expenses by Subtype is a financial metric that categorizes operating expenses by subtype, allowing businesses to track and analyze their expenses by type. This metric helps businesses identify areas where costs can be reduced or optimized, and can be used to create budgets and forecasts.
Xero
This metric displays the predicted total cost of sales for different categories in a budget, providing insight into the expected expenses for goods sold over a specified period.
Xero
Closing Cash Balance is the amount remaining in a Xero account at the end of a period and is calculated by subtracting total expenses and withdrawals from total deposits and income.
Xero
The Draft Invoices Amount metric in Xero shows the total value of all invoices that have been created but not yet sent to customers for payment.
Xero
Return on Investment (ROI) is a financial metric used to evaluate the profitability of an investment. It measures the gain or loss of an investment relative to the initial cost, expressed as a percentage per year (p.a.).
Xero
The Average Creditors Days metric is a measure of how long it takes a business to pay its suppliers. It is calculated by dividing accounts payables by the average daily cost of goods sold and is a key indicator of a company's cash flow management and supplier relationships.
Xero
The Quotes Sent metric tracks the number of quotes or estimates sent to potential customers, providing insights into sales activity and potential revenue.
Xero
Fixed assets are long-term, tangible resources that a business owns and uses in its operations.
Compare
Databox Inc.
HQ: Boston, MA, USA
AI-powered analytics for teams that need answers now.
Databox Inc.
HQ: Boston, MA, USA

AI-powered analytics for teams that need answers now.


Compare