
Track all of your key business metrics from one screen
GET STARTED
 Shopify
Discounts
Shopify
Discounts Discounts metric shows the total amount of discounts offered by the store to customers over a given period of time. It helps in analyzing the effectiveness of promotional activities and their impact on the store's revenue.
With Databox you can track all your metrics from various data sources in one place.
The Discounts metric tracks and quantifies the overall value of discounts that a business provided to customers during a specific timeframe.
This metric can help businesses understand the efficiency of promotional activities and their impact on overall revenue.
These discounts can be in the form of markdowns, promotional codes, free shipping, gift cards, loyalty rewards, bundle deals, or any other incentive that reduces the standard purchase price.
To calculate the discounts metric, you basically need to sum up the monetary value of each discount you ran in the specific time period.
The formula is simple:
Discounts Metric = Value of all discounts offered
Suppose an ecommerce store offered the following discounts during a particular month:
To calculate discounts for the given period, simply add up the value of all the discounts:
Discounts Metric = $500 (smartphone discount) + $300 (laptop discount) + $100 (headphone discount) + $50 (free shipping) = $950
Using the formula, we see that the discount value for the specified month is $950 for the ecommerce store.
Discounts are one of the best tools for attracting new customers, boosting sales, and fostering long-term customer loyalty – and this isn’t anything new.
However, simply offering discounts without a thoughtful approach won’t get you far.
To really leverage the power of discounts, you need well-crafted strategies that will push customers over the purchasing edge and make your offers almost impossible to ignore.
Here are a few interesting strategies you can try out:
More resources to help you improve:

Used to show a simple Metric or to draw attention to one key number.
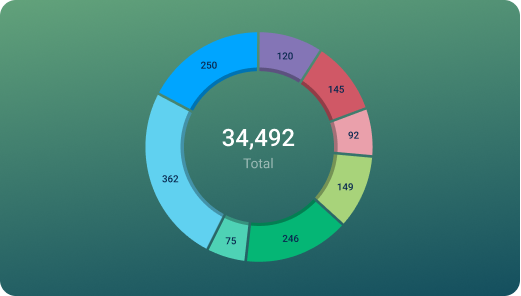
Used to illustrate numerical proportions through the size of the slices.

Used to show comparisons between values.
Databox is a business analytics software that allows you to track and visualize your most important metrics from any data source in one centralized platform.
To track Discounts using Databox, follow these steps:
 Goals
Goals Scorecards
 Metric Digest
 Metric Builder
 Data Calculations
 Performance Screen
Elevate your Shopify store with Databox's E-commerce Sales Performance template. Gain insights on Total Sales, Orders, Gross/Net Sales, and Average Order Value empower data-driven decisions, fostering growth and maximizing revenue.
Use this Shopify report to share important ecommerce performance metrics around orders, sales, products, customers, and more.
One of the best ways to measure discount success is by evaluating KPIs such as conversion rate, average order value (AOV), and overall profitability. These metrics help determine whether (and how much) the discounts have been effective.
The two main types of discounts are:
The most effective type of discount for your business will depend on your specific goals, business model, industry, and target audience. It usually takes a while of testing and refining until you find just the right approach.
Percentage-based discounts are generally more effective for promoting higher-priced items or encouraging larger purchases, while fixed-amount discounts tend to be more useful for lower-priced items.
A combination of both discount types in a well-planned and targeted approach is usually the most effective.
Shopify
Net sales is the total sales revenue generated by a business after accounting for returns, discounts, and other deductions. It is a key metric to measure a company's profitability.
Shopify
Equates to Gross Sales - Discounts - Returns + Taxes + Shipping Charges during the specified Date Range. Total Sales will be a positive number for a Sale on the date that an order was placed, and a negative number for a return on the date that an order was Refunded.
Shopify
The Orders metric on Shopify represents the total number of purchases completed by customers, providing insights into sales performance, customer behavior and trends.
Shopify
The Net Sales by New vs Returning Customers metric shows the revenue generated by customers who are either new to the store or have made a repeat purchase. It helps to identify which group brings in more revenue and informs customer acquisition and retention strategies.
Shopify
The Net Sales by Product Vendor metric shows the total sales revenue generated by each vendor that contributed to the sale of products on the Shopify store.
Shopify
Orders by Tag is a metric in Shopify that allows you to track the number and value of orders based on assigned tags. This gives you insight into customer behavior and trends, allowing you to make data-driven decisions on product offerings and marketing strategies.
Shopify
This metric allows Shopify store owners to track the effectiveness of their discount campaigns based on the location of the customer's billing city. It provides insights on which cities are responding well to discounts and can aid in targeting future promotions.
Shopify
Returns metric measures the number and percentage of orders that are returned by customers. This helps to track customer satisfaction and identify potential issues with product quality or delivery.
Compare
Databox Inc.
HQ: Boston, MA, USA
AI-powered analytics for teams that need answers now.
Databox Inc.
HQ: Boston, MA, USA

AI-powered analytics for teams that need answers now.


Compare