
Track all of your key business metrics from one screen
GET STARTED
 Stripe
Transactions
Stripe
Transactions Transactions metric represents the total number of successful payments processed through Stripe, including charges, refunds, and payouts, measured over a specific time period.
With Databox you can track all your metrics from various data sources in one place.
Transactions represent the total number of successful payment or purchase activities that took place within a specific platform that the business uses.
It encompasses all completed transactions and captures essential details such as the transaction amount, currency, payment method utilized, and transaction status.
By tracking transactions, businesses can get granular insights into their revenue generation, customer behavior, and payment processes.
To calculate the transactions metric, you need to simply count the number of successful transactions within the defined time period you’re interested in.
The formula is straightforward:
Transactions = Total number of successful payment or purchase activities
Let’s say an ecommerce website processed thousands of orders during a particular month, but wants to get an exact figure.
They saw these numbers:
… And so on for each day of June.
After adding up all the successful transactions for the month of June, the website can get the total count of transactions for that period.
Although, it’s unlikely that any business will have to manually calculate this metric since these figures can usually be found within the software that you use to process the transactions
Managing digital transactions can quickly get out of hand if you don’t have the right processes in place.
Sure, the transactions will be recorded in the software and you’ll probably have some reports to extract, but that’s not what we mean by proper tracking.
Here are some of the things you can do to better track your transactions and avoid getting lost in the numbers:
More resources to help you improve:

Used to show a simple Metric or to draw attention to one key number.
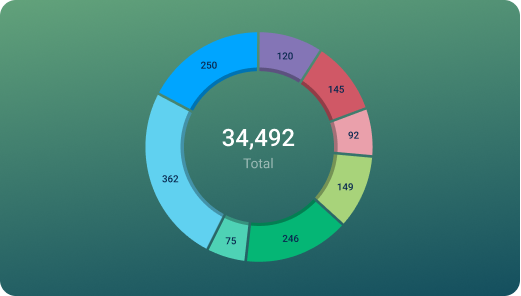
Used to illustrate numerical proportions through the size of the slices.

Used to show comparisons between values.
Databox is a business analytics software that allows you to track and visualize your most important metrics from any data source in one centralized platform.
To track Transactions using Databox, follow these steps:
 Goals
Goals Scorecards
 Metric Digest
 Metric Builder
 Data Calculations
 Performance Screen
Stripe
Performance Screen
Stripe
Payments metric refers to the number of successful transactions processed by a business or organization using Stripe payment processing technology. It provides insight into revenue, customer buying behavior, and financial performance.
Stripe
Refunds metric measures the amount of money refunded to customers for a specific period of time. It helps businesses understand how much revenue they have lost due to refunds and identify areas for improvement in their product or service.
Stripe
Churned MRR (Delinquent) is a metric that represents the revenue lost due to payment failures by customers who are considered delinquent and have not updated their billing information.
Stripe
New Subscriptions (incl. Trials and Inactive Plans) metric tracks the number of new recurring payments or subscription sign-ups including Trials, Active Plans, and Inactive Plans made by customers in a given period of time.
Stripe
New Subscriptions (incl. Trials and Inactive Plans) by Plan Name metric measures the number of new subscriptions including Trials, Active Plans, and Inactive Plans created for each plan in a given time frame, providing insights into the performance and popularity of different subscription plans.
Stripe
Sent Invoices metric refers to the total amount of invoices sent to customers during a specific period. It is a useful measure of a company's invoicing and billing performance, and can help identify any issues or opportunities for improvement in the invoicing process.
Stripe
Overdue Invoices Amount metric in Stripe tracks the total amount of unpaid invoices that are past their due date, providing an overview of the outstanding balance that customers owe.
Stripe
MRR by Plan Name is a metric that measures the total Monthly Recurring Revenue generated by each subscription plan offered by a business. It helps businesses assess the popularity and profitability of different subscription plans, and make data-driven decisions on pricing, promotions and product offering.
Compare
Databox Inc.
HQ: Boston, MA, USA
AI-powered analytics for teams that need answers now.
Databox Inc.
HQ: Boston, MA, USA

AI-powered analytics for teams that need answers now.


Compare