
Track all of your key business metrics from one screen
GET STARTED
 Outreach
Opportunities
Outreach
Opportunities The Opportunities metric measures the number of potential new business or partnership opportunities generated through outreach efforts.
With Databox you can track all your metrics from various data sources in one place.
Opportunities refer to the potential new business prospects or partnership openings that are generated as a result of outreach efforts and marketing activities.
Simply put, opportunities are leads that have shown interest in a business’s products, services, or offerings.
This metric is useful for any business aiming to expand its customer base, generate more revenue, or establish valuable partnerships in its industry.
Calculating opportunities involves quantifying the number of potential new business or partnership prospects.
You should establish clear criteria for what qualifies as an opportunity based on your business’s objectives.
For example, it could be a website inquiry, a completed contact form, a request for a product demo, or any other meaningful interaction that indicates interest.
Once you have that, the formula is pretty simple:
Opportunities = Total count of qualified opportunities within the specified time period
Let’s say a software company that wants to calculate opportunities for the second quarter (April to June) of a given year.
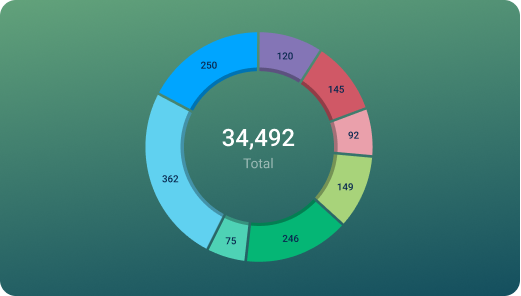
During the second quarter, the company recorded the following qualified opportunities:
Let’s use the formula:
Total Opportunities = 50 + 25 + 40 + 30 = 145
In this example, the software company generated 145 opportunities during the second quarter of the year.
If there’s one thing most business owners will agree on, it’s that there are never enough opportunities and leads.
More opportunities lead to more conversions, which leads to more money generated for the business.
However, increasing the number of opportunities you get for your business requires a lot of experimenting, brainstorming, and refining different marketing strategies.
Below, you’ll find a few useful strategies we got from talking to industry experts over the years:
More resources to help you improve:

Used to show a simple Metric or to draw attention to one key number.
Used to illustrate numerical proportions through the size of the slices.

Used to show comparisons between values.
Databox is a business analytics software that allows you to track and visualize your most important metrics from any data source in one centralized platform.
To track Opportunities using Databox, follow these steps:
 Goals
Goals Scorecards
 Metric Digest
 Metric Builder
 Data Calculations
 Performance Screen
Sales opportunities are important because they represent potential leads with an expressed interest in a company’s products or services. Tracking and analyzing opportunities help businesses identify prospective customers and enable more focused sales efforts.
Different companies use different ways of identifying sales opportunities.
They can be identified by monitoring customer interactions such as website inquiries, completed contact forms, demo requests, or expressions of interest in a product.
Furthermore, leads that come from marketing campaigns, referrals, or networking events can also indicate potential sales opportunities.
Creating sales opportunities basically comes down to how well you understand your customer, their desires, and their pain points.
If you know how to properly address these things and what to address with your advertising and messaging, you can easily turn more prospects into qualified sales opportunities.
Outreach
Total Prospects is the number of potential customers or leads in a specific market or segment that your outreach efforts are targeting.
Outreach
Bounced Emails is a metric that measures the number of emails that failed to be delivered to the recipient's inbox due to reasons like an invalid email address or a full inbox. It helps to identify the quality of the email list and the health of your email sending practices.
Outreach
The Replied Emails metric measures the number or percentage of emails sent that received a response from the recipient. It indicates the effectiveness of email outreach and the level of engagement with the target audience.
Outreach
Positive Replies by Sequence is a metric that measures the number of favorable responses received in a sequence of outreach efforts, indicating the effectiveness of the messaging strategy.
Outreach
Opt Outs by Sequence measures the number of people who have opted out of receiving further communication from a specific outreach sequence or campaign.
Outreach
Replies by Sequence measures the number of email sequences that receive a reply from a prospect. It helps to optimize outreach campaigns for better engagement.
Outreach
Completed Tasks by Completer measures the number of tasks accomplished by each individual team member. It helps track their productivity and efficiency in completing assigned tasks over a period of time.
Outreach
Total Answered Calls is a metric that tracks the total number of calls that were successfully answered by a representative during a specific period of time. It is a key performance indicator for measuring the effectiveness of a call center or outreach program.
Compare
Databox Inc.
HQ: Boston, MA, USA
AI-powered analytics for teams that need answers now.
Databox Inc.
HQ: Boston, MA, USA

AI-powered analytics for teams that need answers now.


Compare
